This property has sold on January 22, 2008. Looking for something similar? Contact us or browse available homes.
401 53rd
Austin, TX, 78751
Per MLS rules, only the primary photo is shown for non-Keenan closed listings.
This property is no longer actively listed. We can help you find similar homes currently for sale, notify you if this property relists, or explore off-market opportunities in the area.
$775,000
last listedWhy you're seeing this property: Unlike major portals that hide off-market listings, we maintain the most comprehensive Austin property database. View market history, neighborhood data, and discover similar homes currently for sale. #1 Austin Realtor Team 2024.
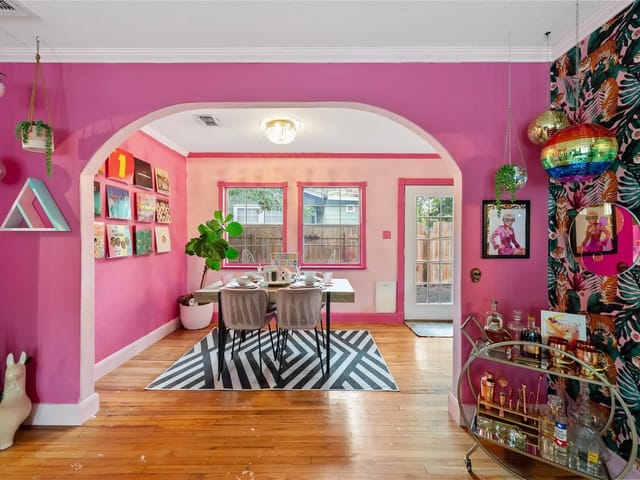
GREAT LOCATION, VERY WELL MAINTAINED, 100% OCCUPIED, LR ZONING. OWNER FINANCING IS AVAILABLE.Property Condition is As Is
Property Type
Commercial Sale
Year Built
1969
Lot Size
0.14 acres
Listed by Coldwell Banker United REALTOR
Property Details
Flooring
Features
Construction
Lot Features
Foundation
Patio / Porch
Parking
Waterfront
Verified property facts
401 53rd is listed at $775,000 with 0.14-acre lot. This places it above the 78751 median of $720,000.
401 53rd is presented by the Keenan Group at Compass Real Estate, the #1 Austin Board of Realtors Team (2024) with 1,000+ career transactions and $1B+ in career volume across Austin's luxury market.
With 20% down ($155,000) on a 30-year fixed mortgage at approximately 6.75%, the estimated monthly payment for 401 53rd is around $5,442 including principal, interest, and estimated taxes. Actual payment varies by rate, down payment, insurance, and HOA fees.
At $775,000, 401 53rd is in the Highlands market where there are currently 44 active listings in 78751. The Keenan Group has completed 8 transactions in 78751 as part of 1,000+ career sales totaling $1B+ across Austin.
401 53rd was built in 1969 (57 years ago). Buyers should budget for potential updates to major systems.
#1 Austin Board of Realtors Team. Over 1,000 successful transactions with high-end expertise.
25+ years advising buyers and sellers in this community
Listing timeline with current price, original ask, and market time.
Public record data from county appraisal records. Market value can differ from assessed value.
| Year | Taxes | Total Assessment | Land | Additions |
|---|---|---|---|---|
2025-32.6% | — | $1,082,605 | $281,250 | $801,355 |
2024+10.1% | — | $1,606,644 | $281,250 | $911,955 |
2023+7.9% | — | $1,458,956 | $281,250 | $1,325,394 |
2022+5.8% | — | $1,351,892 | $281,250 | $1,177,706 |
2021 | — | $1,277,587 | $281,250 | $1,070,642 |
District context schools are shown because address-level assigned school fields are not available for this property. Contact the school district directly to verify current boundaries and enrollment eligibility. Ratings from GreatSchools.org.
20% ($155K)
$775,000
Luxury property intelligence
A sourced read on Highlands pricing, timing, and property scale. No automated valuation claim.
List price
$775,000
Price per sqft
Not available
Vs. Highlands median
Not available
Days on market
6,998 days
Original to current
No verified reduction
$775K original
Active inventory context
Ask for current inventory
Source: MLS Grid / Unlock MLS and Keenan Group review as of Mar 25, 2026.
Request Private Market AnalysisZIP-level neighborhoods, schools, lifestyle, and Austin market context
District guide, nearby schools, and homes by attendance area
Private Austin CMA, TCAD context, and pricing strategy
Pricing, prep, launch timing, and Compass marketing strategy
#1 ABOR Team 2024 with $1B+ career sales volume
401 53rd includes verified waterfront access: None. Buyers should confirm shoreline, dock rights, and floodplain status during due diligence.
Answers use visible listing facts, school context, and neighborhood data available on this page. Verify time-sensitive details before making decisions.
5 events on record
Timeline data compiled from MLS records and public records. Information deemed reliable but not guaranteed.
| Year | Taxes | Total Assessment | Land | Additions |
|---|---|---|---|---|
2025-32.6% | — | $1,082,605 | $281,250 | $801,355 |
2024+10.1% | — | $1,606,644 | $281,250 | $911,955 |
2023+7.9% | — | $1,458,956 | $281,250 | $1,325,394 |
2022+5.8% | — | $1,351,892 | $281,250 | $1,177,706 |
2021 | — | $1,277,587 | $281,250 | $1,070,642 |
Timeline merges MLS activity (when permitted) with public records. Some details may be restricted to registered VOW clients.
Best Match
Balanced against price, location, and layout so nearby lookalikes rise first. Similar properties in Highlands
Comparable homes that recently closed in this area
Active listings near 401 53rd
Recent sales for market context