This property has sold on February 3, 2020. Looking for something similar? Contact us or browse available homes.

Per MLS rules, only the primary photo is shown for non-Keenan closed listings.
This property is no longer actively listed. We can help you find similar homes currently for sale, notify you if this property relists, or explore off-market opportunities in the area.
$590,000
last listedWhy you're seeing this property: Unlike major portals that hide off-market listings, we maintain the most comprehensive Austin property database. View market history, neighborhood data, and discover similar homes currently for sale. #1 Austin Realtor Team 2024.
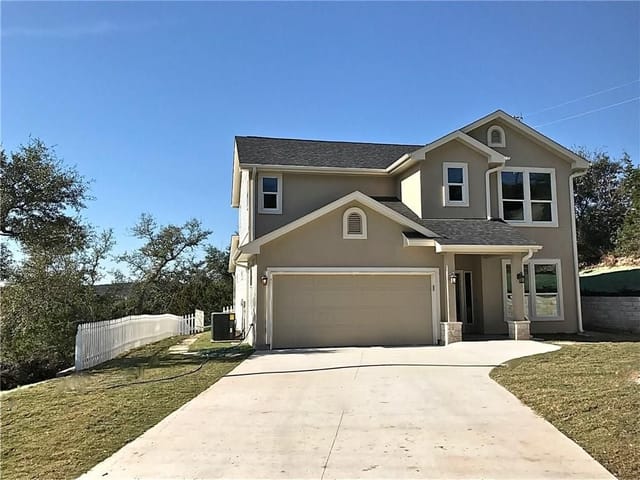
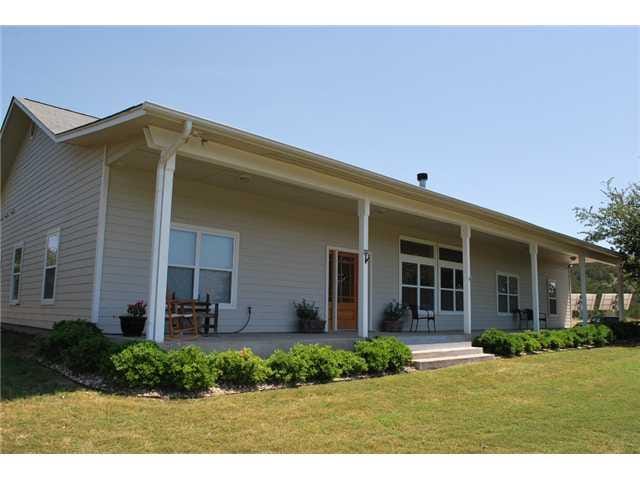
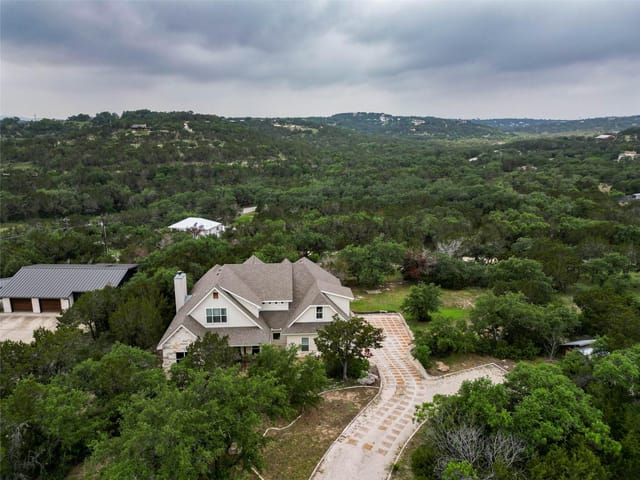
Privacy is the key to this property. You wouldn't know it was there if you didn't really look for it! Abundance of trees surround this private and custom built property. Views of lake and surrounding hill country. Koi pond right outside the door to enjoy. Garage apartment has living, dining, kitchen, bathroom and bed, plus a storage room. Country French decor and design will delight!Guest Accommodations: Yes Restrictions: Yes Sprinkler Sys:Yes
Property Type
Residential
Year Built
2004
Lot Size
1.55 acres
$/Sq Ft
$232
Listed by Moreland Properties
Property Details
Verified property facts
437 Paleface Point Dr is listed at $590,000 with 3 bedrooms, 2 full, 1 half bathrooms, 2,546 square feet, 1.55-acre lot.
437 Paleface Point Dr is zoned for Marble Falls ISD with assigned schools: Spicewood (Marble Falls ISD) (elementary), Marble Falls (middle), Marble Falls (high). School assignments should be verified directly with the district.
437 Paleface Point Dr is a Residential built in 2004 featuring 3 bedrooms, 2 full, 1 half bathrooms, 2,546 square feet, 1.55-acre lot.
437 Paleface Point Dr is presented by the Keenan Group at Compass Real Estate, the #1 Austin Board of Realtors Team (2024) with 1,000+ career transactions and $1B+ in career volume across Austin's luxury market.
With 20% down ($118,000) on a 30-year fixed mortgage at approximately 6.75%, the estimated monthly payment for 437 Paleface Point Dr is around $4,143 including principal, interest, and estimated taxes. Actual payment varies by rate, down payment, insurance, and HOA fees.
#1 Austin Board of Realtors Team. Over 1,000 successful transactions with high-end expertise.
Listing timeline with current price, original ask, and market time.
Public record data from county appraisal records. Market value can differ from assessed value.
| Year | Taxes | Total Assessment | Land | Additions |
|---|---|---|---|---|
2025-1.2% | — | $1,492,775 | $197,862 | $100,693 |
2024+54.0% | — | $1,511,202 | $989,310 | $587,546 |
2023+73.2% | — | $981,000 | $830,550 | $777,112 |
2022+5.9% | — | $566,510 | $315,000 | $666,000 |
2021 | — | $535,000 | $88,200 | $478,310 |
Zoned assignments come from the property school fields available to us. District context schools are shown only when an assigned tier is missing. Contact the school district directly to verify current boundaries and enrollment eligibility. Ratings from GreatSchools.org.
20% ($118K)
$590,000
Luxury property intelligence
A sourced read on pricing, timing, and property scale. No automated valuation claim.
List price
$590,000
Price per sqft
$232/sqft
Vs. neighborhood median
Not available
Days on market
Not available
Original to current
$10K reduction
$600K original
Active inventory context
Ask for current inventory
Source: MLS Grid / Unlock MLS and Keenan Group review as of Apr 25, 2026.
Request Private Market AnalysisZIP-level neighborhoods, schools, lifestyle, and Austin market context
District guide, nearby schools, and homes by attendance area
Private Austin CMA, TCAD context, and pricing strategy
Pricing, prep, launch timing, and Compass marketing strategy
#1 ABOR Team 2024 with $1B+ career sales volume
Answers use visible listing facts, school context, and neighborhood data available on this page. Verify time-sensitive details before making decisions.
6 events on record
Timeline data compiled from MLS records and public records. Information deemed reliable but not guaranteed.
| Year | Taxes | Total Assessment | Land | Additions |
|---|---|---|---|---|
2025-1.2% | — | $1,492,775 | $197,862 | $100,693 |
2024+54.0% | — | $1,511,202 | $989,310 | $587,546 |
2023+73.2% | — | $981,000 | $830,550 | $777,112 |
2022+5.9% | — | $566,510 | $315,000 | $666,000 |
2021 | — | $535,000 | $88,200 | $478,310 |
Timeline merges MLS activity (when permitted) with public records. Some details may be restricted to registered VOW clients.
Comparable homes that recently closed in this area
Best Match
Balanced against price, location, and layout so nearby lookalikes rise first. Properties with similar features
Recent sales for market context